Reports
How do I read the Cash Flow graph?
Understand the Cash Flow graph on the Finance AI home screen, including income, spending, and projected cash flow.
Quick answer
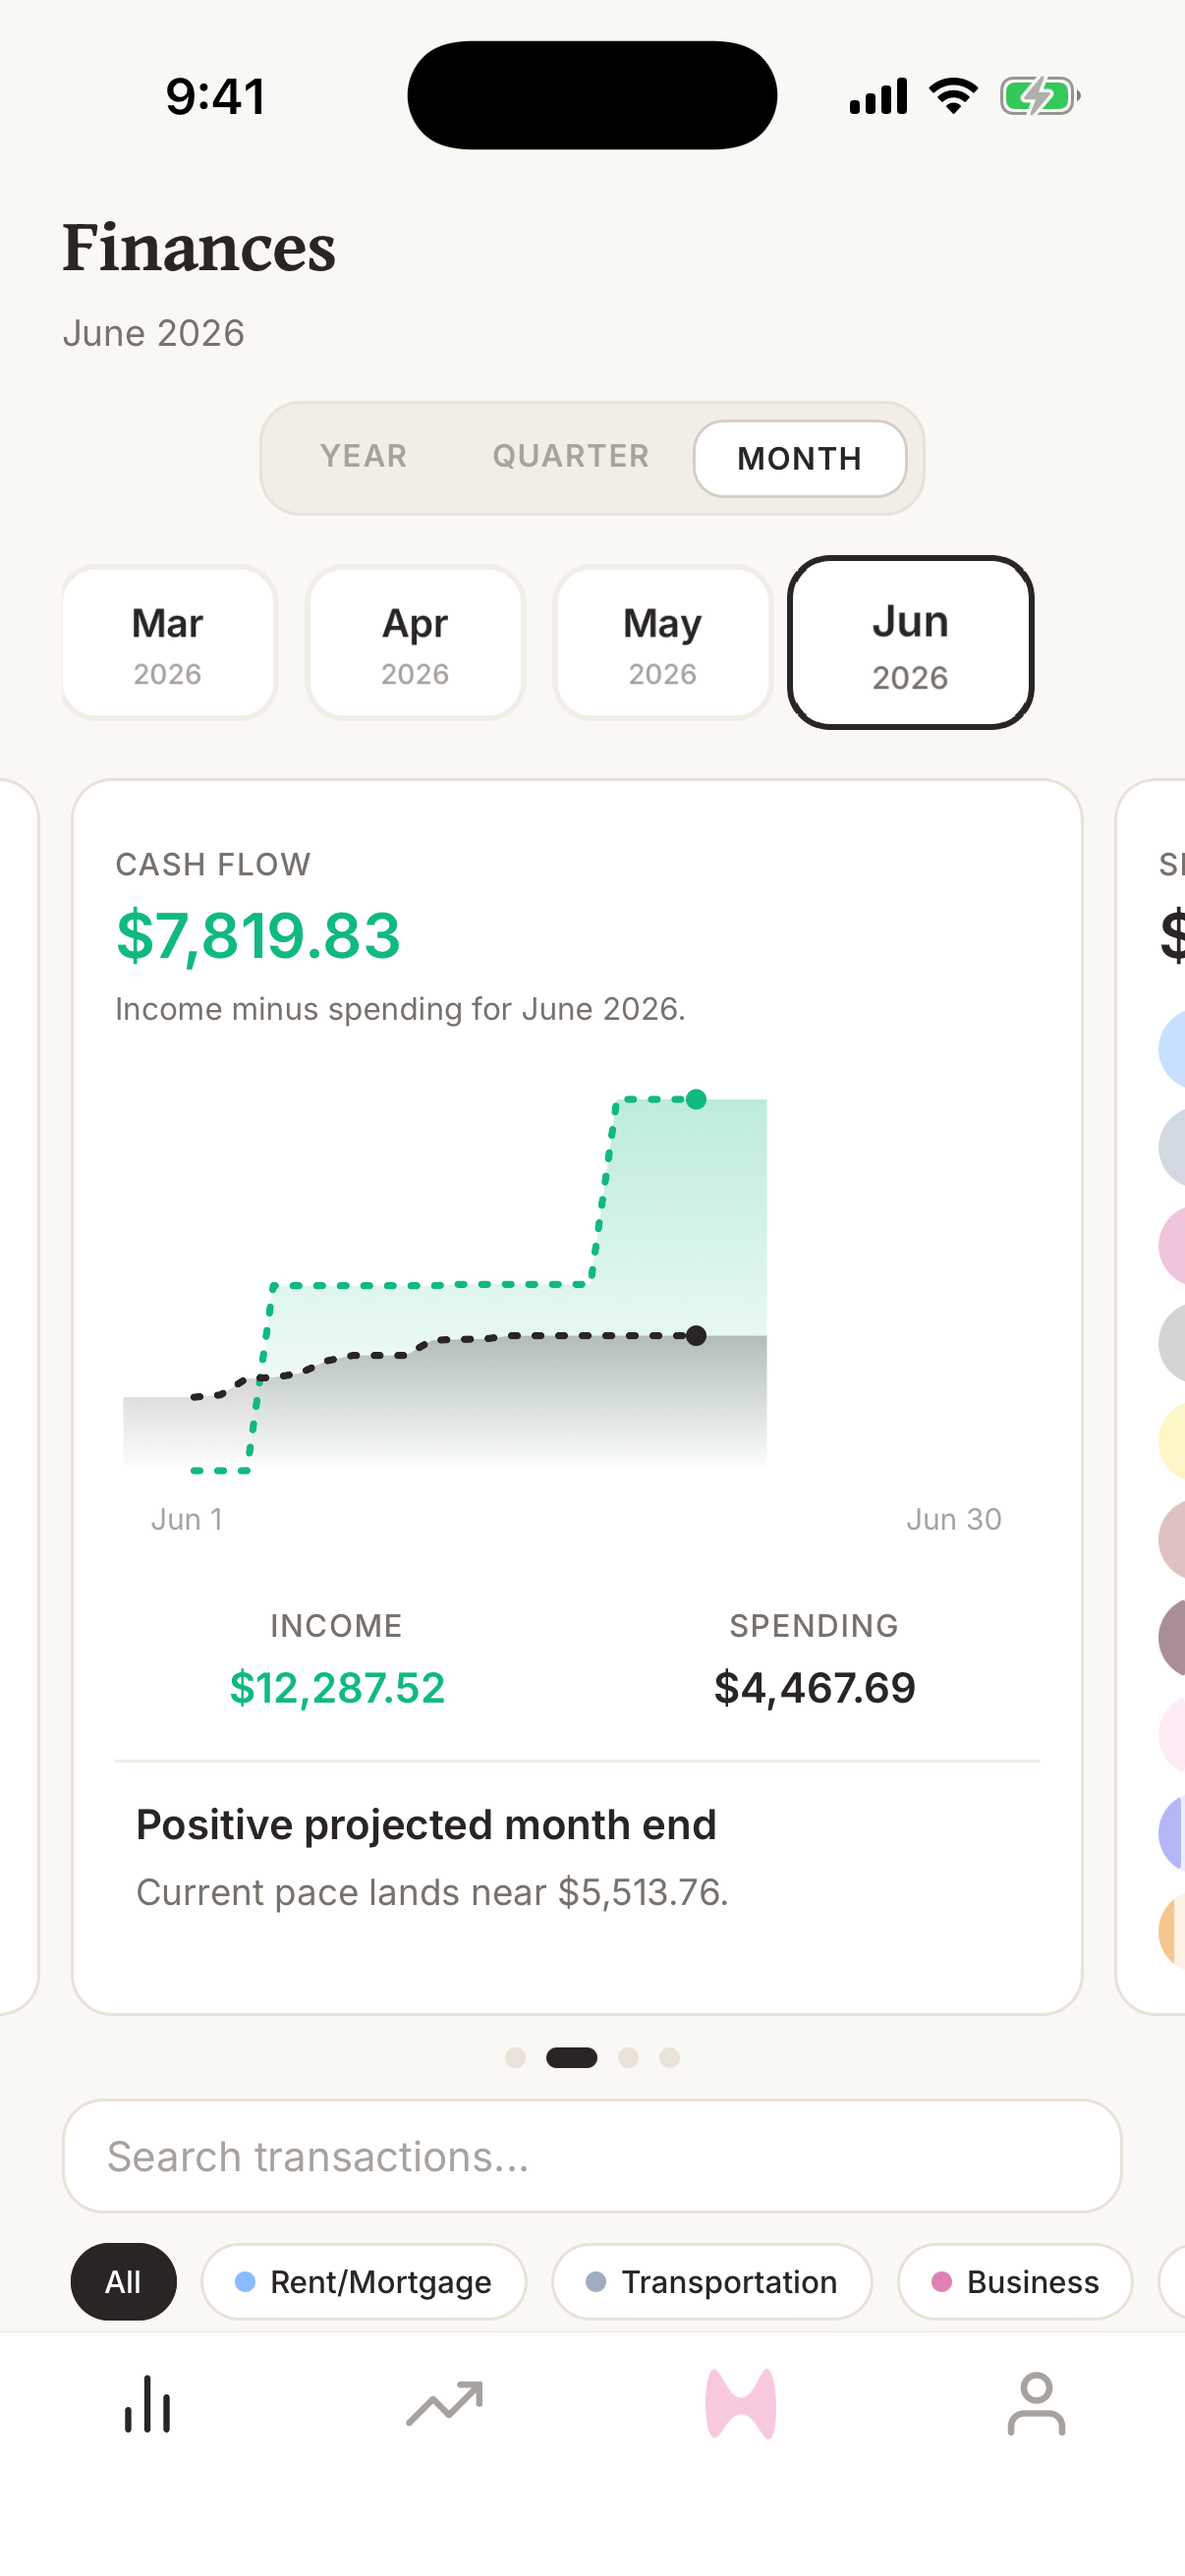
The Cash Flow graph shows income minus spending for the selected period. Solid lines show actual income and spending, while dashed future lines use your previous three completed months to estimate upcoming income, spending, and cash flow.
Steps
- 1Open Finance AI on your iPhone.
- 2Go to the home screen.
- 3Swipe the graph carousel until you see Cash Flow.
- 4Read the headline number as income minus spending for the selected period.
- 5Compare the Income and Spending totals below the chart.
- 6Press and drag across the chart to inspect cash flow through an earlier day in the period.
- 7Drag into a future date to preview the cash flow Finance AI expects by then.
What the graph means
Cash Flow is income minus spending for the selected period. A positive number means income is ahead of spending. A negative number means spending is ahead of income.
The chart builds day by day during the month. Both income and spending lines include pending and posted transactions, so recent activity affects cash flow right away.
How projections work
Finance AI learns recurring income from your previous three completed months. It groups income by category and account, then checks amount and timing patterns for monthly, weekly, biweekly, and similar pay schedules. Transaction descriptions and merchant names are not used.
The dashed income projection begins from today's actual income and rises around expected paydays. The gray spending reference is the exact same full-month personalized curve shown on Spending Goal, with the same values, recurring-payment jumps, and steady growth between them; the separate black line shows actual spending through today.
The message below the graph calls out the next expected income amount and date when a stable pattern is available, plus the projected cash flow at the end of the selected period.
Projection language is directional. It helps you spot whether the month is pacing positive or negative, but it can change quickly after payroll, rent, large purchases, refunds, or corrected transaction dates.
Why the graph may look wrong
Cash Flow depends on transaction dates, categories, and whether a transaction is income, spending, or a transfer. If the chart looks off, check recent transactions first.
- Change the transaction date if a transaction posted in the wrong month.
- Change the category if income, spending, or transfer activity is being counted incorrectly.
- Pending income and spending are included, but a pending transaction can change amount, date, or category when the bank posts it.
Frequently asked questions
How do I read the Cash Flow graph?
The Cash Flow graph shows income minus spending for the selected period. Solid lines show actual income and spending, while dashed future lines use your previous three completed months to estimate upcoming income, spending, and cash flow.
What the graph means?
Cash Flow is income minus spending for the selected period. A positive number means income is ahead of spending. A negative number means spending is ahead of income. The chart builds day by day during the month. Both income and spending lines include pending and posted transactions, so recent activity affects cash flow right away.
How projections work?
Finance AI learns recurring income from your previous three completed months. It groups income by category and account, then checks amount and timing patterns for monthly, weekly, biweekly, and similar pay schedules. Transaction descriptions and merchant names are not used. The dashed income projection begins from today's actual income and rises around expected paydays. The gray spending reference is the exact same full-month personalized curve shown on Spending Goal, with the same values, recurring-payment jumps, and steady growth between them; the separate black line shows actual spending through today.
Why the graph may look wrong?
Cash Flow depends on transaction dates, categories, and whether a transaction is income, spending, or a transfer. If the chart looks off, check recent transactions first. Change the transaction date if a transaction posted in the wrong month. Change the category if income, spending, or transfer activity is being counted incorrectly. Pending income and spending are included, but a pending transaction can change amount, date, or category when the bank posts it.