Reports
How do I read the Spending Goal graph?
Understand the Spending Goal graph, the single monthly goal line, and how Finance AI tracks spending pace across the month.
Quick answer
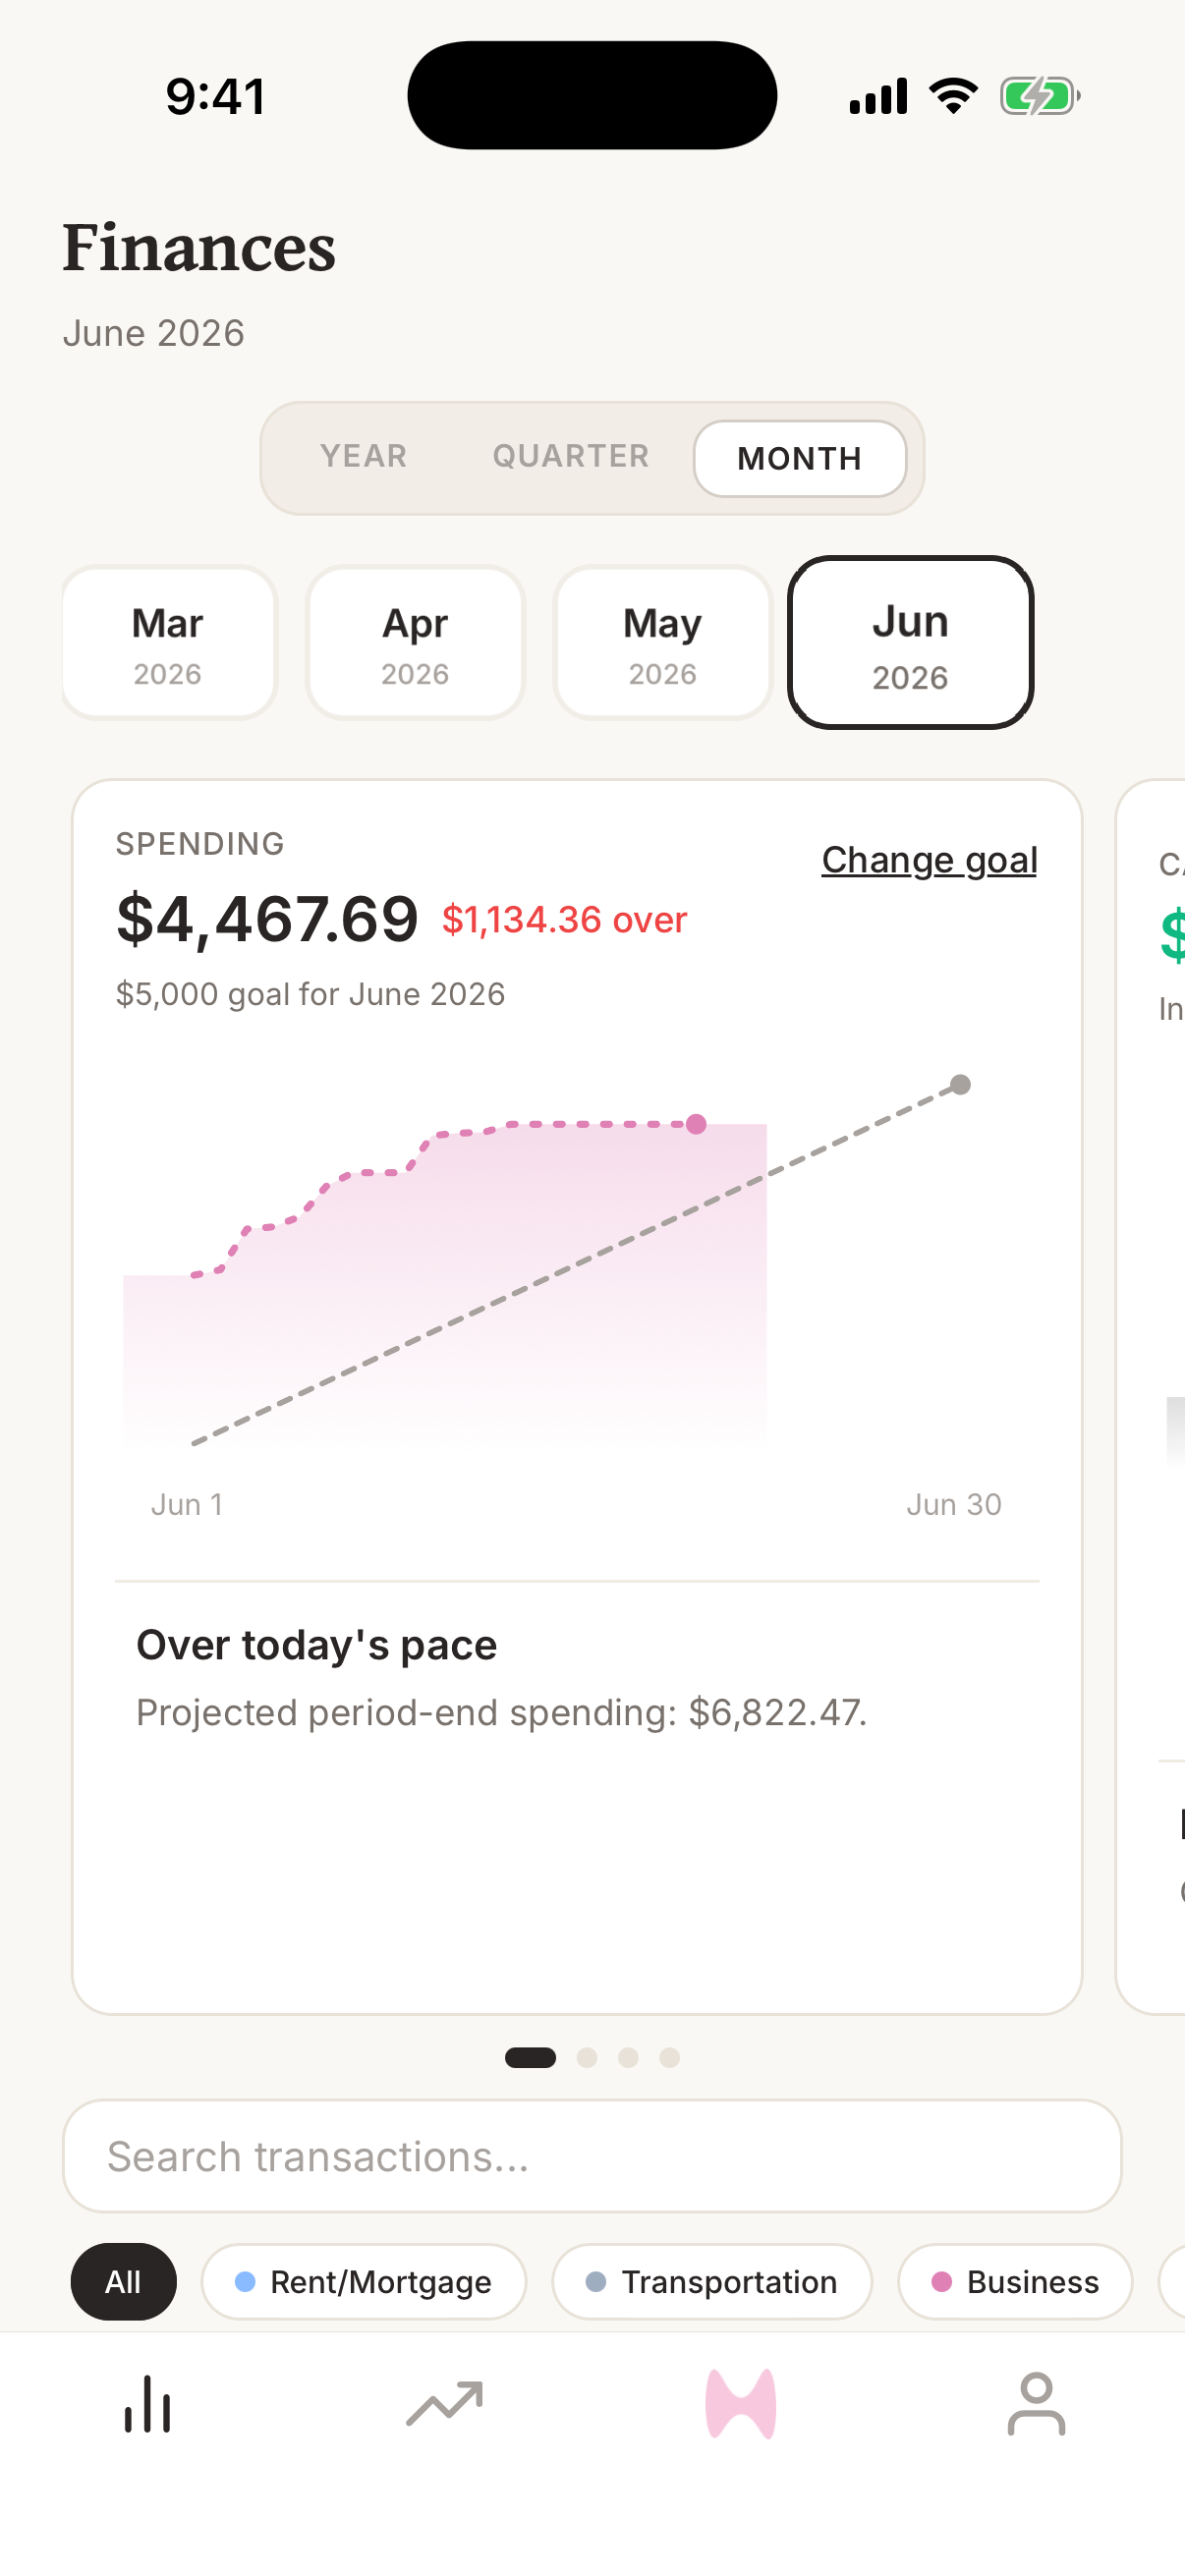
The Spending Goal graph compares your current spending against a personalized monthly pace built from your previous three completed months. Large recurring hits appear as labeled jumps, while flexible spending grows steadily between them.
Steps
- 1Open Finance AI on your iPhone.
- 2Go to the home screen.
- 3Swipe the graph carousel until you see Spending Goal.
- 4Read the headline amount as spending so far this month.
- 5Compare the spending line to the goal line to see whether the month is pacing above or below goal.
- 6Press and drag across the chart to inspect actual spending through today or preview the personalized goal pace on a future date.
- 7If an insight appears below the graph, tap View full to open the complete insight in Settings, or tap X to hide that insight from the graph for the current insight period.
- 8Update your monthly spending goal from Settings if the target needs to change.
One simple monthly goal
Finance AI uses one monthly spending goal instead of many category budgets. That keeps the target easy to understand: spend less than the monthly goal overall, then use category breakdowns to learn what is driving the total.
This is meant to be simple to track from the home screen. You do not need to maintain separate goals for restaurants, groceries, subscriptions, travel, and every other category unless you want to inspect those categories later.
Pull down on the Finances screen when you want to sync fresh bank activity. The refresh spinner is reserved for that deliberate gesture; background data refreshes and bottom-tab switches do not show or pin the pull-to-refresh control.
How the goal line is calculated
Finance AI looks at your previous three completed months for large recurring transactions in the same category and account with a similar amount and monthly date. Merchant names and transaction descriptions are not used. Those payments create step-like jumps in the goal line, labeled with the category—such as Rent or Transportation—in small text below the jump.
The gray personalized goal line spans the entire selected month, including days that have not happened yet. The spending line stops at the latest available day, so you can compare actual spending so far with the remaining monthly plan.
The pink spending line and its shaded area stop on today according to your device timezone. The gray goal line continues through the final day because it represents the rest of the plan, not future transactions.
When you drag across today or an earlier date, the headline compares actual spending through that day with the personalized pace for the same day. Dragging beyond today switches to a future goal preview: the headline shows the planned pace for the selected date without claiming that future spending is under or over pace. The chart's right-hand date remains the last day of the selected month.
A payment generally needs to be at least $150 to create a jump. The goal-relative cutoff is capped at $500 so a normal car or loan payment is not hidden just because the overall spending goal is high. When only two monthly hits qualify, their amounts must match especially closely before Finance AI treats them as recurring.
A recurring payment can create a jump even when its broader category also contains smaller purchases. Amount and date patterns separate a stable monthly car payment from car washes or charging purchases in Transportation, without requiring it to represent most of the category's spending.
Consistent credits in the same category and near the same date reduce the expected jump. For example, a recurring renter payment categorized with the mortgage is netted against the mortgage step.
The rest of the monthly goal grows steadily between those personalized jumps. A category such as Groceries that is large only because many purchases add up across the month stays in that steady portion instead of creating a jump.
With one completed month, Finance AI can build a provisional personalized pace. If there is no completed spending month yet, the graph says it is learning your pace instead of showing a generic line.
What counts toward the graph
The spending line uses pending and posted ordinary spending transactions for the current month, so a recent purchase affects goal progress before it posts. Income and transfers are separated so they do not distort goal progress.
A credit or refund categorized with an expense reduces spending in that same category. The category is floored at zero, so an early credit—such as a renter payment arriving before the mortgage—does not make the main Spending amount negative.
Changing a transaction date or category can move spending above or below the goal line because the transaction may move into a different month or stop counting as spending.
Frequently asked questions
How do I read the Spending Goal graph?
The Spending Goal graph compares your current spending against a personalized monthly pace built from your previous three completed months. Large recurring hits appear as labeled jumps, while flexible spending grows steadily between them.
What should I know about one simple monthly goal?
Finance AI uses one monthly spending goal instead of many category budgets. That keeps the target easy to understand: spend less than the monthly goal overall, then use category breakdowns to learn what is driving the total. This is meant to be simple to track from the home screen. You do not need to maintain separate goals for restaurants, groceries, subscriptions, travel, and every other category unless you want to inspect those categories later.
How the goal line is calculated?
Finance AI looks at your previous three completed months for large recurring transactions in the same category and account with a similar amount and monthly date. Merchant names and transaction descriptions are not used. Those payments create step-like jumps in the goal line, labeled with the category—such as Rent or Transportation—in small text below the jump. The gray personalized goal line spans the entire selected month, including days that have not happened yet. The spending line stops at the latest available day, so you can compare actual spending so far with the remaining monthly plan.
What counts toward the graph?
The spending line uses pending and posted ordinary spending transactions for the current month, so a recent purchase affects goal progress before it posts. Income and transfers are separated so they do not distort goal progress. A credit or refund categorized with an expense reduces spending in that same category. The category is floored at zero, so an early credit—such as a renter payment arriving before the mortgage—does not make the main Spending amount negative.